How to replicate the GA4 Path Exploration report with BigQuery SQL?
The New Google Analytics (GA4) comes with a new Exploration feature, which allows GA users to deep-dive into their data — beyond the capabilities of the built-in standard reports. While the standard reports allow for monitoring key business metrics, the Exploration section makes advanced analytical techniques accessible to generate ad hoc insights quickly.
The analytical techniques available are the following:
- Free-form exploration
- Cohort exploration
- Funnel exploration
- Segment overlap
- User exploration
- User lifetime
- Path exploration
Check out the official Google documentation for a more detailed introduction to GA4’s powerful Explorations feature.
Path Exploration in GA4
The Path exploration report lets you visualize user interactions from a specific event/page forward (starting point) or backward (ending point) in an aggregated manner. Analysts using this technique can answer questions like:
- What top pages do new users open after visiting the home page?
- What is the effect of an event on subsequent user actions?
- Which pages have broken links to 404 pages?
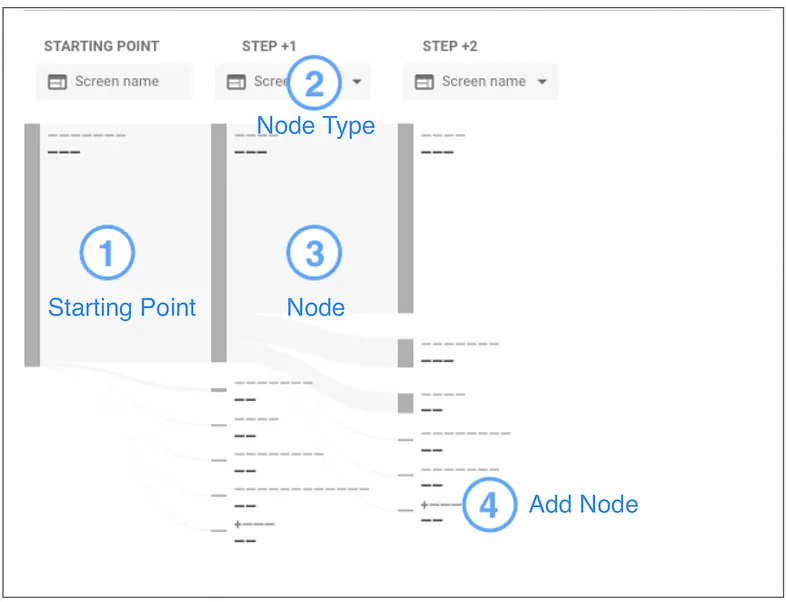
 Elements of Path exploration (https://support.google.com/analytics/answer/9317498?hl=en&ref_topic=9266525)
The visualization is a Sankey diagram, where each node represents an event or page. Analysts can arbitrarily add nodes to reveal more sequence elements and apply segments, filters, and breakdown dimensions to tailor the report to their needs.
Turning to BigQuery to extract the data
While this analysis technique is powerful, it is not always the ideal tool to share these insights with stakeholders — especially to those unfamiliar with GA. Luckily, with GA4, all users have the opportunity to export their GA4 data into BigQuery (Google’s cloud-based, fully-managed database designed for analytical workloads).
To constantly monitor critical user flows and embed them into your standard reporting tools (e.g., Looker Studio, Power BI, or Tableau), turning to the GA4 raw data in BigQuery and extracting the data is the way to go. But…
How to replicate a basic GA4 Path Exploration report in BigQuery?
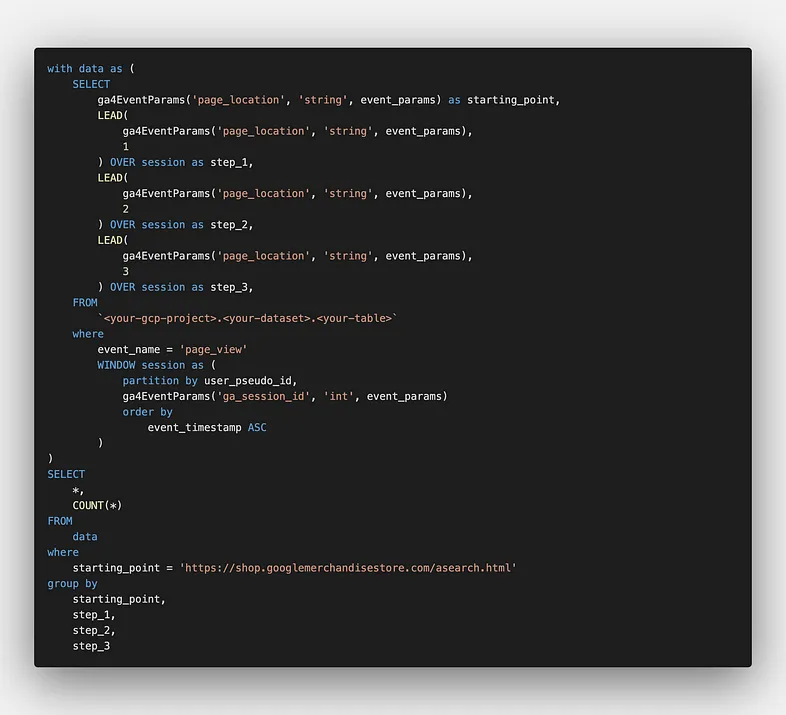
We can utilize window functions in BigQuery to aggregate the page_location sequences across all sessions measured with GA4 with a query like this:
 Query example for path exploration with a starting point
The query above will return one row for each path and the number of occurrences within the queried table:
 Query result for path exploration with starting point
The query’s core components are the following:
ga4EventParamsfunctionLEAD()function over a sessionWINDOW- Temporary table specified in a
WITHclause
User-defined functions to increase readability
Since we are interested in obtaining the page_location for each associated page_view event, page_location is the key we provide as input to the function. The ga4EventParams function returns the respective value for the input key from the event_params RECORD. For more details, check out Alejandro’s posts on how to use a BigQuery function.
Window functions to query sequences
The LEAD() navigation function allows us to query subsequent rows from a specified window. Changing the offset value alters which subsequent row is returned; the default value is 1, indicating the next row in the window frame. You can use the offset value to add more nodes to your query, depending on your analysis. In the example above, 3 additional nodes have been included (besides the starting point).
The WINDOW clause above will result in the window spanning over a user’s session. To make the window user-scoped, remove the ga_session_id reference.
Temporary tables to store intermediate results
The temporary table allows us to store the resulting table — 1 row per page_view event with the subsequent page_locations as columns — as an intermediate query result in memory (data) and make it available to a later part of the query. The data table is then used in the final FROM clause to count the occurrences of each sequence across all sessions.
How to look back in time?
All nice and dandy, but how to start the sequence with its ending and work our way back from there?
Fair question, especially since specifying the ending point and analyzing how users ended up there is a crucial function of GA4’s Path exploration technique.
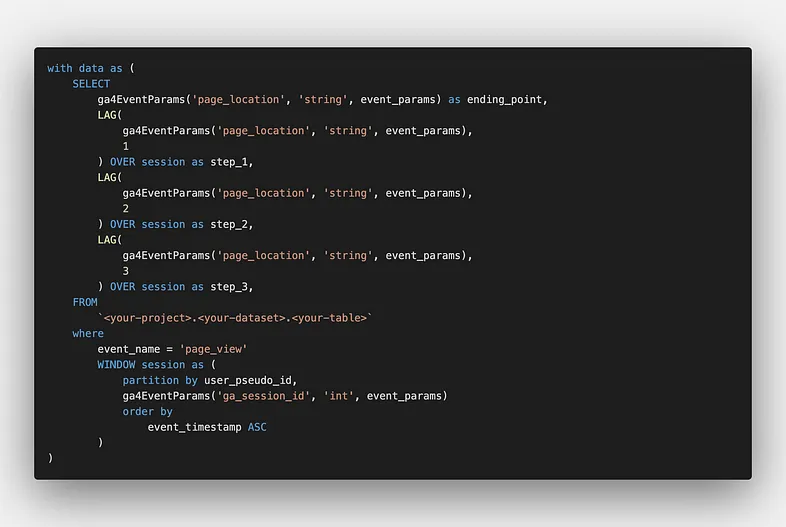
Luckily, this would require just a few minor tweaks within our temporary table, like so:
 Query example for path exploration with an ending point
By simply replacing LEAD() with LAG(), we return the value of the page_location on a preceding row. So, the previous page_view event of a session.
How to start the sequence with the actual landing page?
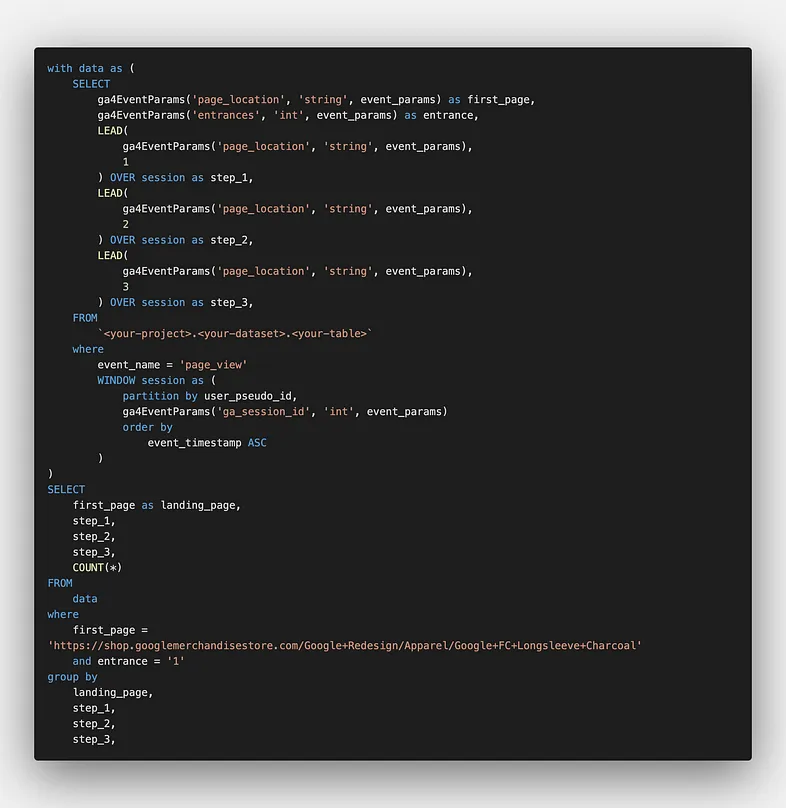
To achieve this, we need to, once again, turn to our familiar LEAD() function and add a column to our temporary table — the entrances event parameter. It will indicate whether or not a certain page_view event was the first within a session and, therefore, is the landing page.
Filtering for sequences that start on the landing page will return the desired result:
 Query example for path exploration with the landing page as a starting point
Final remarks
I hope this piece of context was helpful for you and encourages you to dive deeper into GA4’s BigQuery raw data. From my perspective, having access to the raw data is one of the significant gains you get from migrating from Universal Analytics to GA4.
I intend to identify other use cases to explore the opportunities and limitations of GA4 and BigQuery.
If you require support in making the above or any GA4 raw data analyses work for you, have remarks, or find anything unclear, please contact me. I am always happy to talk analytics!
Book a meeting with me: Calendly